M&A Blog #16 – valuation (Discounted Cash Flow)
As I mentioned in my last post, Discounted Cash Flow (DCF) is a valuation method that uses free cash flow projections, a discount rate, and a growth rate to find the present value estimate of a potential investment. Essentially, it is a way to value a company based on cash generated from operation, taking into account all major expenses. In this post, we will discuss the mechanics of DCF step by step, starting from the point where all the needed tools and data for such analysis as outlined in my valuation preparation post have been gathered.
The major steps of DCF are:
Identify extraordinary, unusual, non-recurring items from the target’s 10-Ks and 10-Qs.
Add back / remove the extraordinary, unusual, non-recurring items to historical income statement to normalize the statement.
Derive proforma assumptions from the target’s normalized historical statements.
Decide on a forecast horizon and whether a 1-stage or 2-stage growth is appropriate.
Build proforma income statement and balance sheet.
Derive Free Cash Flow to Firm (FCFF).
Calculate cost of debt, cost of equity, and weighted average cost of capital (WACC).
Calculate the long-term free cash flow growth rate, the Terminal Value, and the Value of Operation.
Determine the current value of non-operating assets (cash) and the Enterprise Value.
Determine the year-by-year future non-equity claims from the latest 10-K, especially those that will occur during the forecast horizon, and their combined present value.
Calculate the Equity Value and the per-share Equity Value - this number would serve as the base case share price valuation.
Perform sensitivity / scenario analysis using Monte Carlo analysis.
We will delve deeper into each steps above in the following paragraphs of this post. It is worth noting that each step can justifiably warrant an entire post in itself. For the purposes of this post though, we will keep matters concise by discussing only the most practical and commonly accepted aspects of each step.
The 1st step in DCF, identifying extraordinary, unusual, non-recurring items from the target’s last two 10-Ks and 10-Qs are meant to pinpoint income and expenses that the target company had received and paid that are not the normal course of operations. The reason for this identification exercise is simple: these items over- and under-state the actual cash flow of the target, so the income statement would have to be adjusted to reflect the normal state of operations. Some examples of these items are litigation cost, shutdown cost, impairment cost, restructuring cost, acquisition integration expenses, and more. The full list of these items can be found here. The method to find these items are by keyword searches in the target’s 10-Ks and 10-Qs. Once the extraordinary, unusual, non-recurring items are identified, the next (2nd) step is to have them added back / removed from the historical income statement to normalize the financial statement. Expense items are added back and gain items are removed.
The 3rd step in DCF is to derive proforma assumptions from the normalized historical financial statements and there are three parts to this step. First, we state every items in the income statement and balance sheet as a percentage of a larger ticket item that is the base of the assumptions. An example of this would be to state COGS and SGA as percentages of Sales Revenues, or to state Depreciation Expense as a percent of Plant, Property, and Equipment (PPE). Each analyst has his/her own preferences and, assuming adherence to basic accounting principles, these different preferences are okay. For simplicity, I prefer to state everything but interest income and expense as percentages of sales revenue. The logic there is simple: companies tend to spend more when they make more. For interest income and expense, I prefer to state them as percentages of the average debt balance of the last two years. The second part of this step would be to perform a trend analysis and calculate the minimum, maximum, and average over the historical horizon or some parts of it. The goal here is to find a pattern of what the target company has been doing in the past several years, i.e.: have they been growing revenues steadily, or accelerating expenses, or investing more in PPE, and so on. Some time a pattern exists, some time not. The 3rd and final part of this step is to decide what figure or range to use for each item’s proforma assumption based on the existence of the patterns.
The next (4th) step in DCF is to decide on a forecast horizon and whether a 1-stage, 2-stage, or 3-stage growth is appropriate. Valuation professionals differ in the length of forecast horizon, some advocate for not more than 5 years into the future, others advocate for 10, 15, even 30 years. A realistic length for this period depends on the age of the target company. If a company has been around for the last 50 or more years, it is somewhat realistic to assume a longer (10 or 15 years) forecast horizon. If a company has only been around for less than 10 years, I prefer a shorter forecast horizon. The maturity of a company also factors into the number of growth stages that should be modeled in DCF. A mature company that has been around forever (think S&P 500 companies) would be well forecasted using a 1-stage growth model (when there is only one growth rate for the entire forecast horizon). A startup (think recent technology companies) however, might be better served forecasted using a 2-stage growth model (high growth rate in the beginning followed by much lower growth rate in later years) in a 10- or 15- year forecast horizon. Unfortunately, there is no definite standard to the length of forecast horizon and the selection of growth stages to be used, leaving rooms for the valuation professional to practice the “art” part of valuation.
The 5th step in DCF is to build the proforma income statement and balance sheet, using the proforma assumptions, forecast horizon, and the growth stage selected from the previous step. The proforma income statement is built by forecasting the growth of sales throughout the forecast horizon according to the selected growth stage. The rest of the items in the proforma income statement (COGS, SGA, etc.) are then built by forecasting their amounts according to the proforma assumptions discussed in the 3rd step. The proforma balance sheet is built using the proforma assumptions discussed in the 3rd step, with one powerful exception: a plug has to be added to both the asset and the liabilities sides of the balance sheet. These asset and liabilities plugs are meant to help the proforma balance sheet to balance. Remember the cardinal rule in accounting: balance sheet must balance. A common asset plug would be surplus fund and a common liabilities plus would be revolver. It is highly recommended that the proforma balance sheet includes a checksum to make sure it balances (asset = liabilities + equity).
Once the proforma income statement and balance sheet are build, the next (6th) step is then to derive the Free Cash Flow to Firm (FCFF) from these proforma statements. There are several methods in deriving FCFF, the most common ones being the EBIT and the CFO methods. For the sake of comparison, I recommend performing both to make sure that the end FCFFs generated are equal (meaning they are correct for the specific DCF model). The formulas for each methods are as follow:
FCFF-EBIT method = After-tax EBIT + Depreciation & Amortization - Increase in (operating) current assets + Increase in (operating) current liability - Capital Expenditure
FCFF-CFO method = After-tax profit (Net Income) + Depreciation & Amortization - Increase in (operating) current assets + Increase in (operating) current liability - Capital Expenditure + After-tax net interest payment
If the calculations are done correctly, both methods should yield the same FCFF. It is worth noting that, depending on the financial statements and the valuation professional, there might be other items included in each calculation - each addition in one method should be matched with a corresponding addition in the other method to yield the same FCFF.
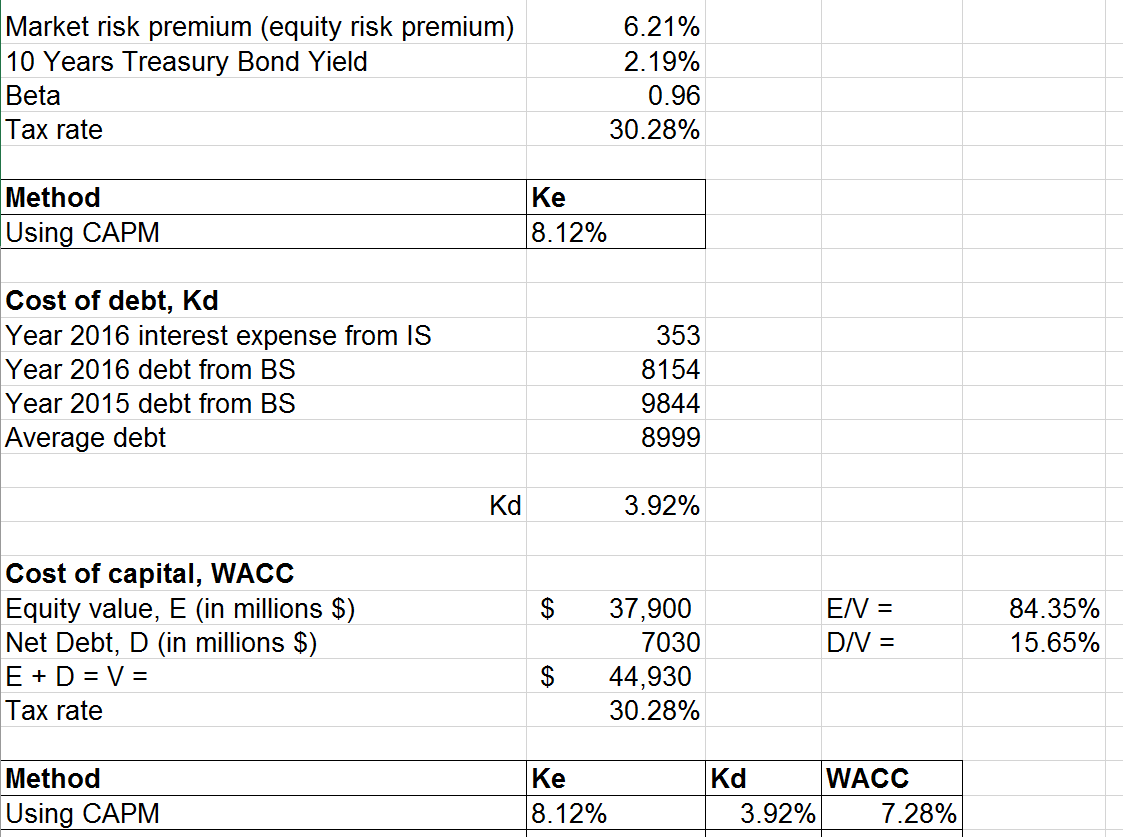
The 7th step in the DCF method calls for the calculations of the cost of debt, cost of equity, and the weighted average cost of capital (WACC). For the cost of debt calculation, I typically use the most current financial year’s normalized interest expense, the average of the debt balances from the two most current financial years, the most current tax rate, and the weight of debt vs total capital in the target’s capital structure. It is a good practice to verify the intended debt-vs-total-capital balance post-transaction when possible. All of these information can be found in the most current 10-K and 10-Q, a better approximation would be to use the normalized historical financial. The cost of debt is then calculated as follow:
The unweighted, pre-tax cost of debt = the interest expense / the average of the debt balances.
The unweighted, post-tax cost of debt = the unweighted, pre-tax cost of debt * (1 - tax rate).
The weighted, post-tax cost of debt = the unweighted, post-tax cost of debt * (the amount of debt / (the amount of debt + the amount of equity)).
The cost of debt = the weighted, post-tax cost of debt.
Please note that, at the time of this writing in July 2017, there is a bill passing through the US Congress to strip the tax treatment of corporate debt. Whether the bill will pass and when are unknown at this time, so it is not incorporated into our calculation.
The cost of equity calculation is more complex. There are multiple theories of how the cost of equity should be calculated: Capital Asset Pricing Model (CAPM), tax-adjusted CAPM, Gordon Dividend Model, and Gordon Equity Payout model to name a few. For the purpose of this post, we will use the most common of them all, CAPM. This approach calls for knowing the target’s beta, the target’s primary country risk-free rate (of borrowing), the primary country’s market risk premium - please see my earlier post on how to get these items here. The approach also calls for knowing the target’s weight of equity vs total capital in the target’s capital structure. It is a good practice to verify the intended equity-vs-total-capital balance post-transaction when possible. All of these information can be found in the most current 10-K and 10-Q, a better approximation is listed below in our calculation of the cost of equity:
Equity as a fraction of total capital = (current stock price * the number of shares outstanding from the most current 10-K) / (the sum of debt and equity).
The unweighted cost of equity = risk-free rate + Beta * (market risk premium - risk-free rate).
The weighted cost of equity = the unweighted cost of equity * equity as a fraction of total capital.
The cost of equity = the weighted cost of equity.
The weighted average cost of capital (WACC) is simply the sum of the cost of debt and the cost of capital.
Some rows in this table are hidden to shortened the length of the table display.
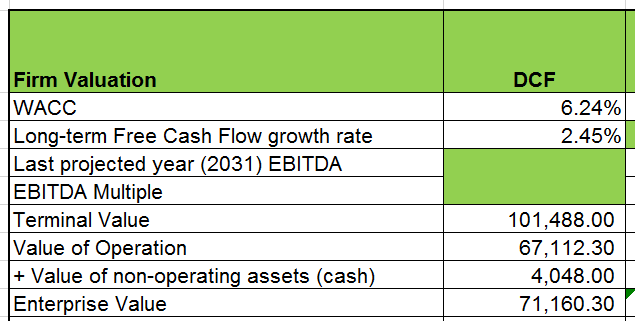
The next (8th) step in the DCF method calls for the calculation of long-term free cash flow growth rate, Terminal Value, and Value of Operation. For the long-term free cash flow growth rate, I typically use the target’s primary country long-term GDP growth rate, adjusted by its sector-specific ROE (see this previous post on how they can be obtained). This approach is known as the top-down method. As with other elements of DCF, there are other theories of approximating this number (bottom-up and hybrid approaches). I have found the top-down method to work fairly well in the past. The Terminal Value and Value of Operation are then calculated as follow:
Terminal Value = the last proforma year’s FCFF previously calculated * (1 + the long-term free cash flow growth rate) / (WACC - the long-term free cash flow growth rate).
The Value of Operation = the Net Present Value of the FCFF with the last year’s FCFF including the Terminal Value * (1 + WACC) ^ (½).
The 9th step in the DCF method calls for the calculation of the current value of non-operating assets and the Enterprise Value. The current value of non-operating assets on the target’s book is typically its cash on the balance sheet. The Enterprise Value is then calculated as follow:
Enterprise Value = the Value of Operation + the current value of non-operating assets.
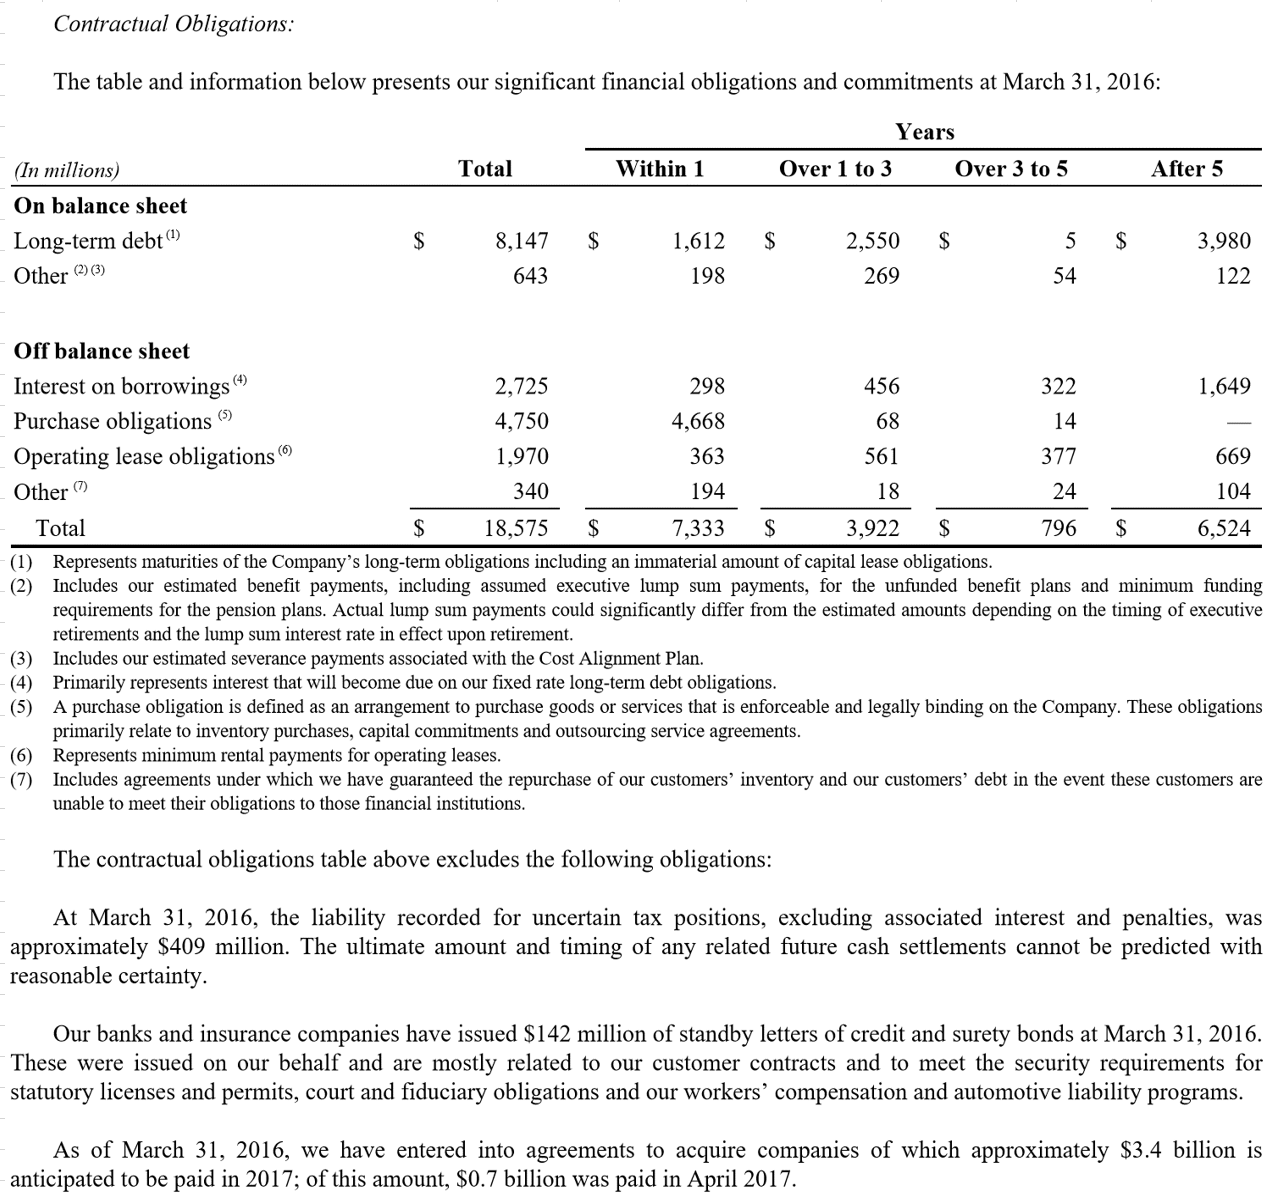
The following (10th) step in the DCF method calls for the calculation of the year-by-year future non-equity claims from the latest 10-K, especially those that will occur during the forecast horizon, and their combined present value. In order to perform this calculation properly, one needs the Contractual Obligation information from the target’s most current 10-K. The goal is to identify the long-term debt, pensions and other liabilities, operating leases, purchase obligations, and other agreements that will require cash outflow from the target (which will reduce its enterprise value). Once these future non-equity claims are identified, they should be allocated to the years the cash outflow is slated to occur, and then discounted back to the present using the WACC.
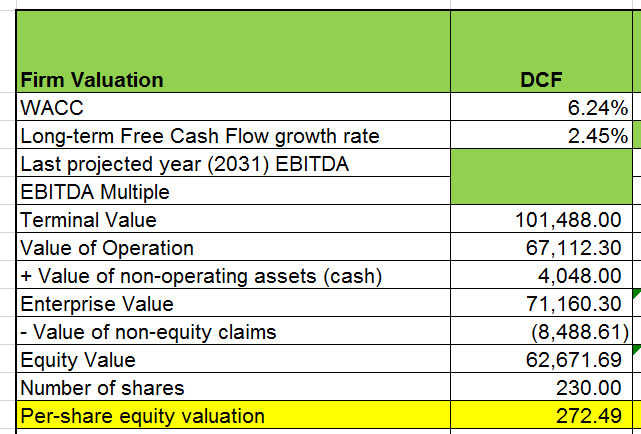
The 11th step in the DCF method is to calculate the Equity Value and Per-share Equity Value as follow:
Equity Value = Enterprise Value - Value of non-equity claims previously calculated.
Per-share Equity Value = Equity Value / Number of shares outstanding.
The 12th and final step in a proper DCF method is to perform sensitivity / scenario analysis, preferably using a Monte Carlo simulation. Because this step is similar in this method as it is in the other valuation methods (Comparable Company, Precedent Transaction, etc.), we will discuss sensitivity / scenario analysis in great details in the last post of this valuation series in 4-5 posts from now.
A sample file for a DCF analysis on the company McKesson can be accessed here; it is recommended to open @RISK first before opening this file due to the Monte Carlo simulation embedded in this file (the file will open with errors without @RISK). To download @RISK for a free trial version, click here.
As we can tell from the steps laid out thus far, DCF has advantages and disadvantages. The advantages include the forward-looking nature of the analysis (DCF can be used on startups with no historical performance), the clarity on what investors are truly buying (free cash flows), the fact that it recognizes the timing of each cash flow (the sooner, the better), and the ease of comparing its results to other corporate projects. DCF’s disadvantages include its complexity (easy to make mistakes), sensitivity (a few over- or under-stated assumptions can highly exaggerate the results), subjectivity (some of the assumptions are difficult to verify independently), and tendency to yield a overly high valuation (typically the highest among the major valuation methods).
So, to re-cap, we have discussed the development of a DCF model and its supporting elements, along with its strengths and weaknesses. It is worth reiterating that, while the broad strokes (steps) are well established, different valuation analysts have different twists when it comes to calculating each supporting elements. Preferences, stages of maturity of the target, and the usage of the valuation results highly influence the result. Given its advantages and disadvantages, DCF is best used in conjunction with other valuation methods. It is only then that the closest-to-correct value of the target can be deduced via comparison. In the next post, we will discuss another valuation method, Comparable Company. Fortunately, some of the work we have done thus far for DCF can be re-purposed for Comparable Company.


